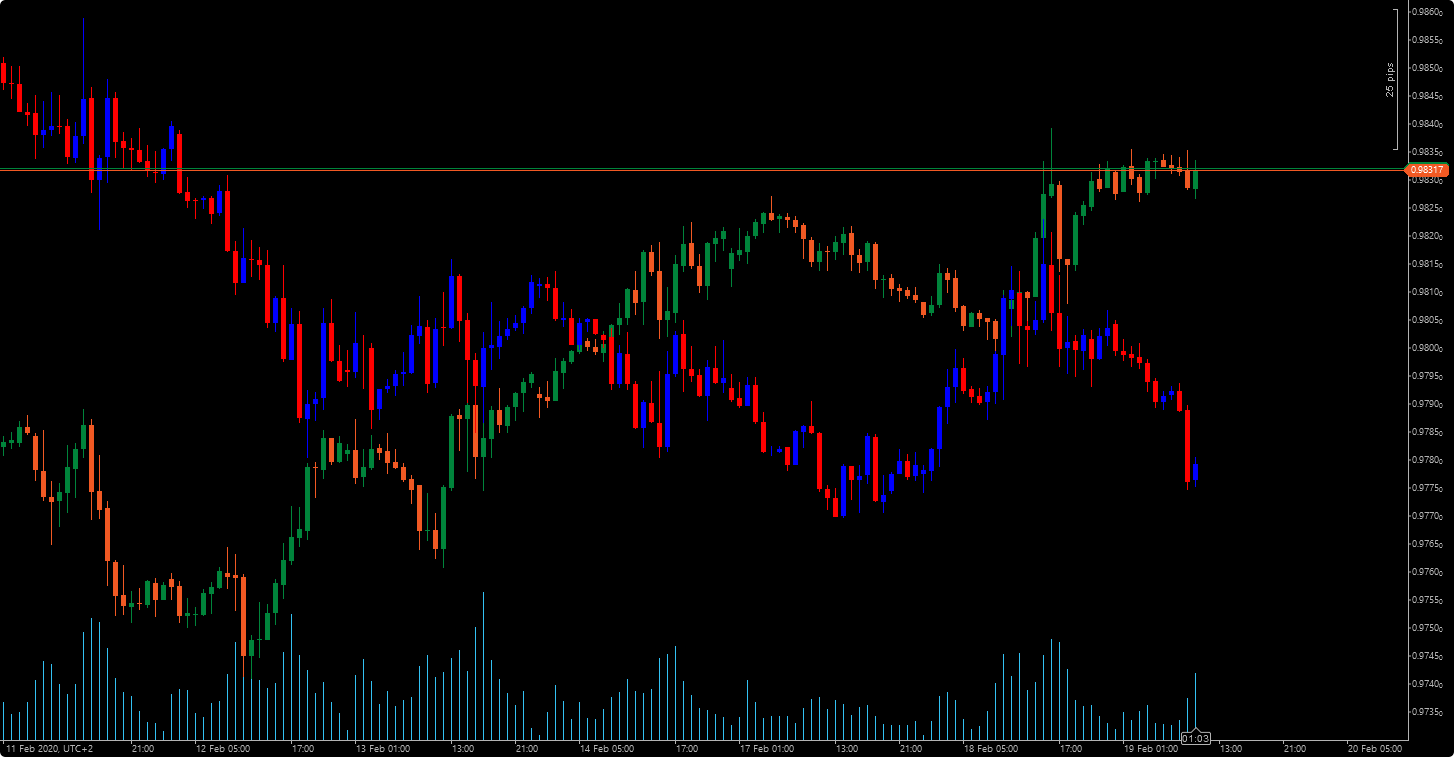
This indicator draws another pair on the chart. Its main use is to easily spot discrepancies between correlated pairs.
Input Parameters
- Symbol: the symbol code of the pair to be plotted.
- Delta Y: value added to the new pair, used to move it up or down on the chart.
- Flip Vertically: indicates whether the new pair should be inverted.
- Periods: is the number of periods to be drawn.
- Candle width: is the candle’s body line width.
Screenshots
Code
using System;
using cAlgo.API;
using cAlgo.API.Internals;
using cAlgo.API.Indicators;
using cAlgo.Indicators;

namespace cAlgo
{
    [Indicator(IsOverlay = true, TimeZone = TimeZones.UTC, AccessRights = AccessRights.None)]
    public class PlotPair : Indicator
    {
        [Parameter("Symbol", DefaultValue = "USDCHF")]
        public string symbolCode { get; set; }

        [Parameter("Delta Y", DefaultValue = 0)]
        public double DeltaY { get; set; }

        [Parameter("Flip Vertically", DefaultValue = false)]
        public bool FlipVertically { get; set; }

        [Parameter("Periods", DefaultValue = 1000)]
        public int Periods { get; set; }

        [Parameter("Candle width", DefaultValue = 5)]
        public int CandleWidth { get; set; }

        [Parameter("Up Candle Color", DefaultValue = "Blue")]
        public string UpCandleColor { get; set; }

        [Parameter("Down Candle Color", DefaultValue = "Red")]
        public string DownCandleColor { get; set; }

        protected override void Initialize()
        {
        }

        public override void Calculate(int index)
        {
            if (!IsLastBar)
                return;

            Bars b = MarketData.GetBars(TimeFrame, symbolCode);
            if (b == null)
                return;

            int p = Math.Min(Periods, Bars.OpenPrices.Count - 1);

            for (int i = 0; i < p; i++)
            {
                double d = Bars.OpenPrices.Last(p) - Math.Pow(b.OpenPrices.Last(p), 1 + Convert.ToInt32(FlipVertically) * -2) + DeltaY;
                double o = Math.Pow(b.OpenPrices.Last(i), 1 + Convert.ToInt32(FlipVertically) * -2) + d;
                double c = Math.Pow(b.ClosePrices.Last(i), 1 + Convert.ToInt32(FlipVertically) * -2) + d;
                double h = Math.Pow(b.HighPrices.Last(i), 1 + Convert.ToInt32(FlipVertically) * -2) + d;
                double l = Math.Pow(b.LowPrices.Last(i), 1 + Convert.ToInt32(FlipVertically) * -2) + d;

                Color cl = Math.Pow(b.OpenPrices.Last(i), 1 + Convert.ToInt32(FlipVertically) * -2) > Math.Pow(b.ClosePrices.Last(i), 1 + Convert.ToInt32(FlipVertically) * -2) ? Color.FromName(DownCandleColor) : Color.FromName(UpCandleColor);
                Chart.DrawTrendLine("body" + symbolCode + i, index - i, o, index - i, c, cl, CandleWidth);
                Chart.DrawTrendLine("tail" + symbolCode + i, index - i, l, index - i, h, cl);
            }
        }
    }
}