This indicator shows how a fixed length linear regression channel changes over time.
Input Parameters
- Source: the price valules used to compute the LRC. Usually set to Close prices.
- MaxBars: the length of the LRC expressed in periods.
- ExtensionBars: the number of bars the LRC is projected into the future.
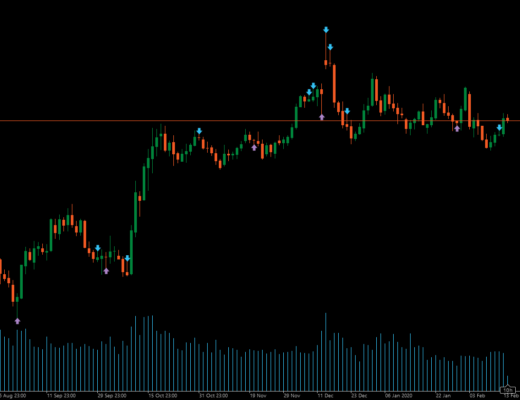
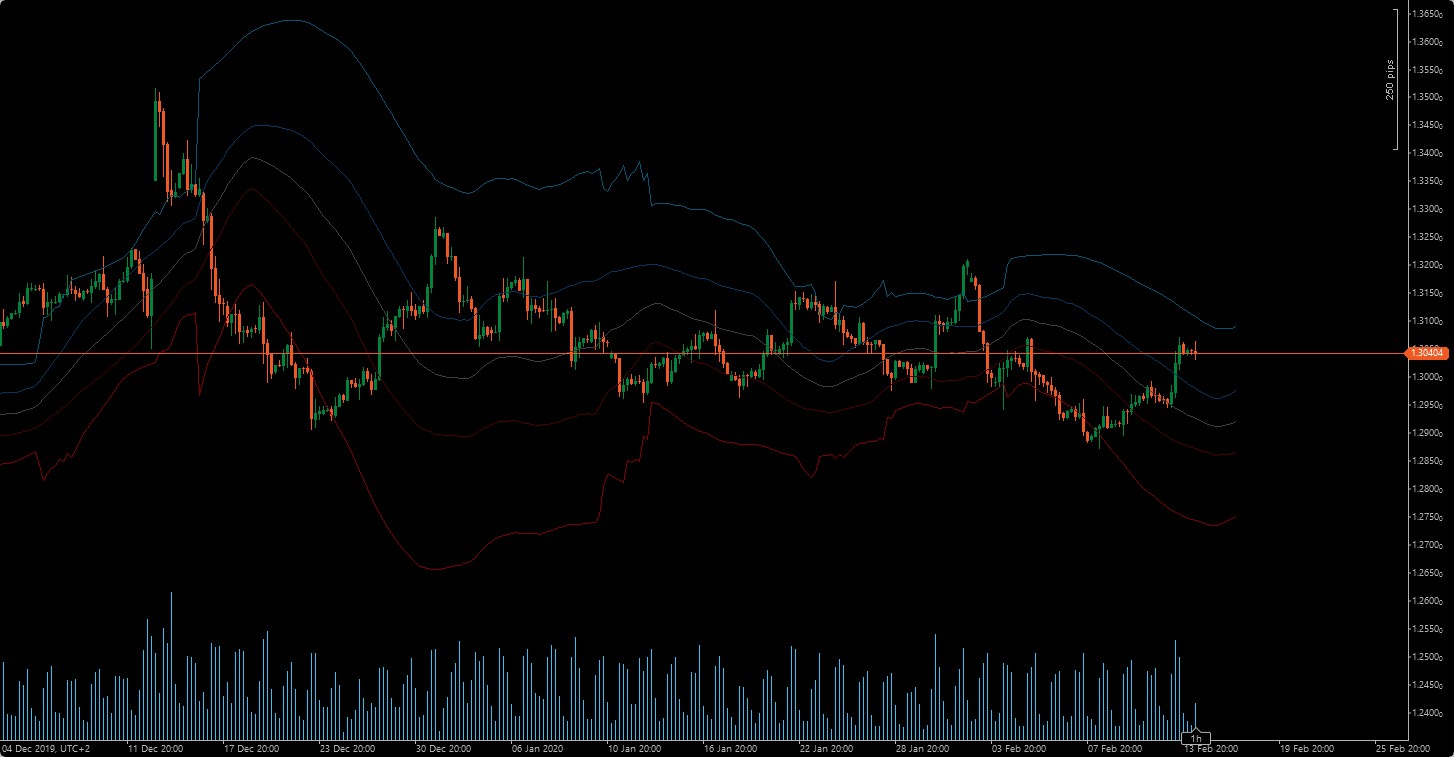
Screenshots
Code
using System;
using cAlgo.API;
using cAlgo.API.Internals;
using cAlgo.API.Indicators;
using cAlgo.Indicators;

namespace cAlgo
{
    [Indicator(IsOverlay = true, TimeZone = TimeZones.UTC, AccessRights = AccessRights.None)]
    public class LRCHistory : Indicator
    {
        [Parameter("Source")]
        public DataSeries Source { get; set; }

        [Parameter(DefaultValue = 100)]
        public int MaxBars { get; set; }

        [Parameter(DefaultValue = 10)]
        public int ExtensionBars { get; set; }

        [Output("Center", LineColor = "#FF3F3F3F")]
        public IndicatorDataSeries Center { get; set; }

        [Output("Top", LineColor = "#FF025776")]
        public IndicatorDataSeries Top { get; set; }

        [Output("Bottom", LineColor = "#FF800001")]
        public IndicatorDataSeries Bottom { get; set; }

        [Output("Dev-Top", LineColor = "#FF013861")]
        public IndicatorDataSeries DevTop { get; set; }

        [Output("Dev-Bottom", LineColor = "#FF490002")]
        public IndicatorDataSeries DevBottom { get; set; }

        protected override void Initialize()
        {
            // Initialize and create nested indicators
        }

        public override void Calculate(int index)
        {
            DataSeries series = Source;
            int Start = 1;
            int Bars = MaxBars;

            // Linear regresion

            double sum_x = 0, sum_x2 = 0, sum_y = 0, sum_xy = 0;

            int start = series.Count - Bars - Start;
            int end = series.Count - 1 - Start;

            for (int i = start; i <= end; i++)
            {
                sum_x += 1.0 * i;
                sum_x2 += 1.0 * i * i;
                sum_y += series[i];
                sum_xy += series[i] * i;
            }

            double a = (Bars * sum_xy - sum_x * sum_y) / (Bars * sum_x2 - sum_x * sum_x);
            double b = (sum_y - a * sum_x) / Bars;

            // Calculate maximum and standard devaitions

            double maxDeviation = 0;
            double sumDevation = 0;

            for (int i = start; i <= end; i++)
            {
                double price = a * i + b;
                maxDeviation = Math.Max(Math.Abs(series[i] - price), maxDeviation);
                sumDevation += Math.Pow(series[i] - price, 2.0);
            }

            double stdDeviation = Math.Sqrt(sumDevation / Bars);

            // draw in future
            end += ExtensionBars;

            double pr1 = a * start + b;
            double pr2 = a * end + b;

            Center[index + ExtensionBars] = pr2;
            Top[index + ExtensionBars] = pr2 + maxDeviation;
            Bottom[index + ExtensionBars] = pr2 - maxDeviation;
            DevTop[index + ExtensionBars] = pr2 + stdDeviation;
            DevBottom[index + ExtensionBars] = pr2 - stdDeviation;
        }


    }
}